013 - The Peraire experiment
WARNING: in my next post, I nuance the conclusions drawn in this post, because of a parameter I didn't correctly set during the training of the models described below. You should really read it after reading this post, to get the full picture!
As a small side project during my phD, I have been sharing my expertise (and a bit of my workforce) with the members of the DIM SPE-VLP project. The acronym stands for "Sauver le patrimoine espérantiste : le voyage de Lucien Péraire (1928-1932)." The project revolves around the digitization, transcription and edition/valorization of Lucien Peraire's archives. He was a French citizen who, in the late 1920s, travelled across the European and the Asian continents, mostly by bike and using Esperanto to communicate. He kept a diary during his journey (and later published a book about his adventures). His notes are written both in French and in Esperanto and in some documents, he also used stenography.
My contribution to the project has mostly consisted in helping developing transcription models for the French diaries (although I'm also interested in the shorthand and the esperanto). This meant both helping with the production of ground truth and training Kraken models. This post will briefly explain how the ground truth was created and published, as well as present the models that were trained with it.
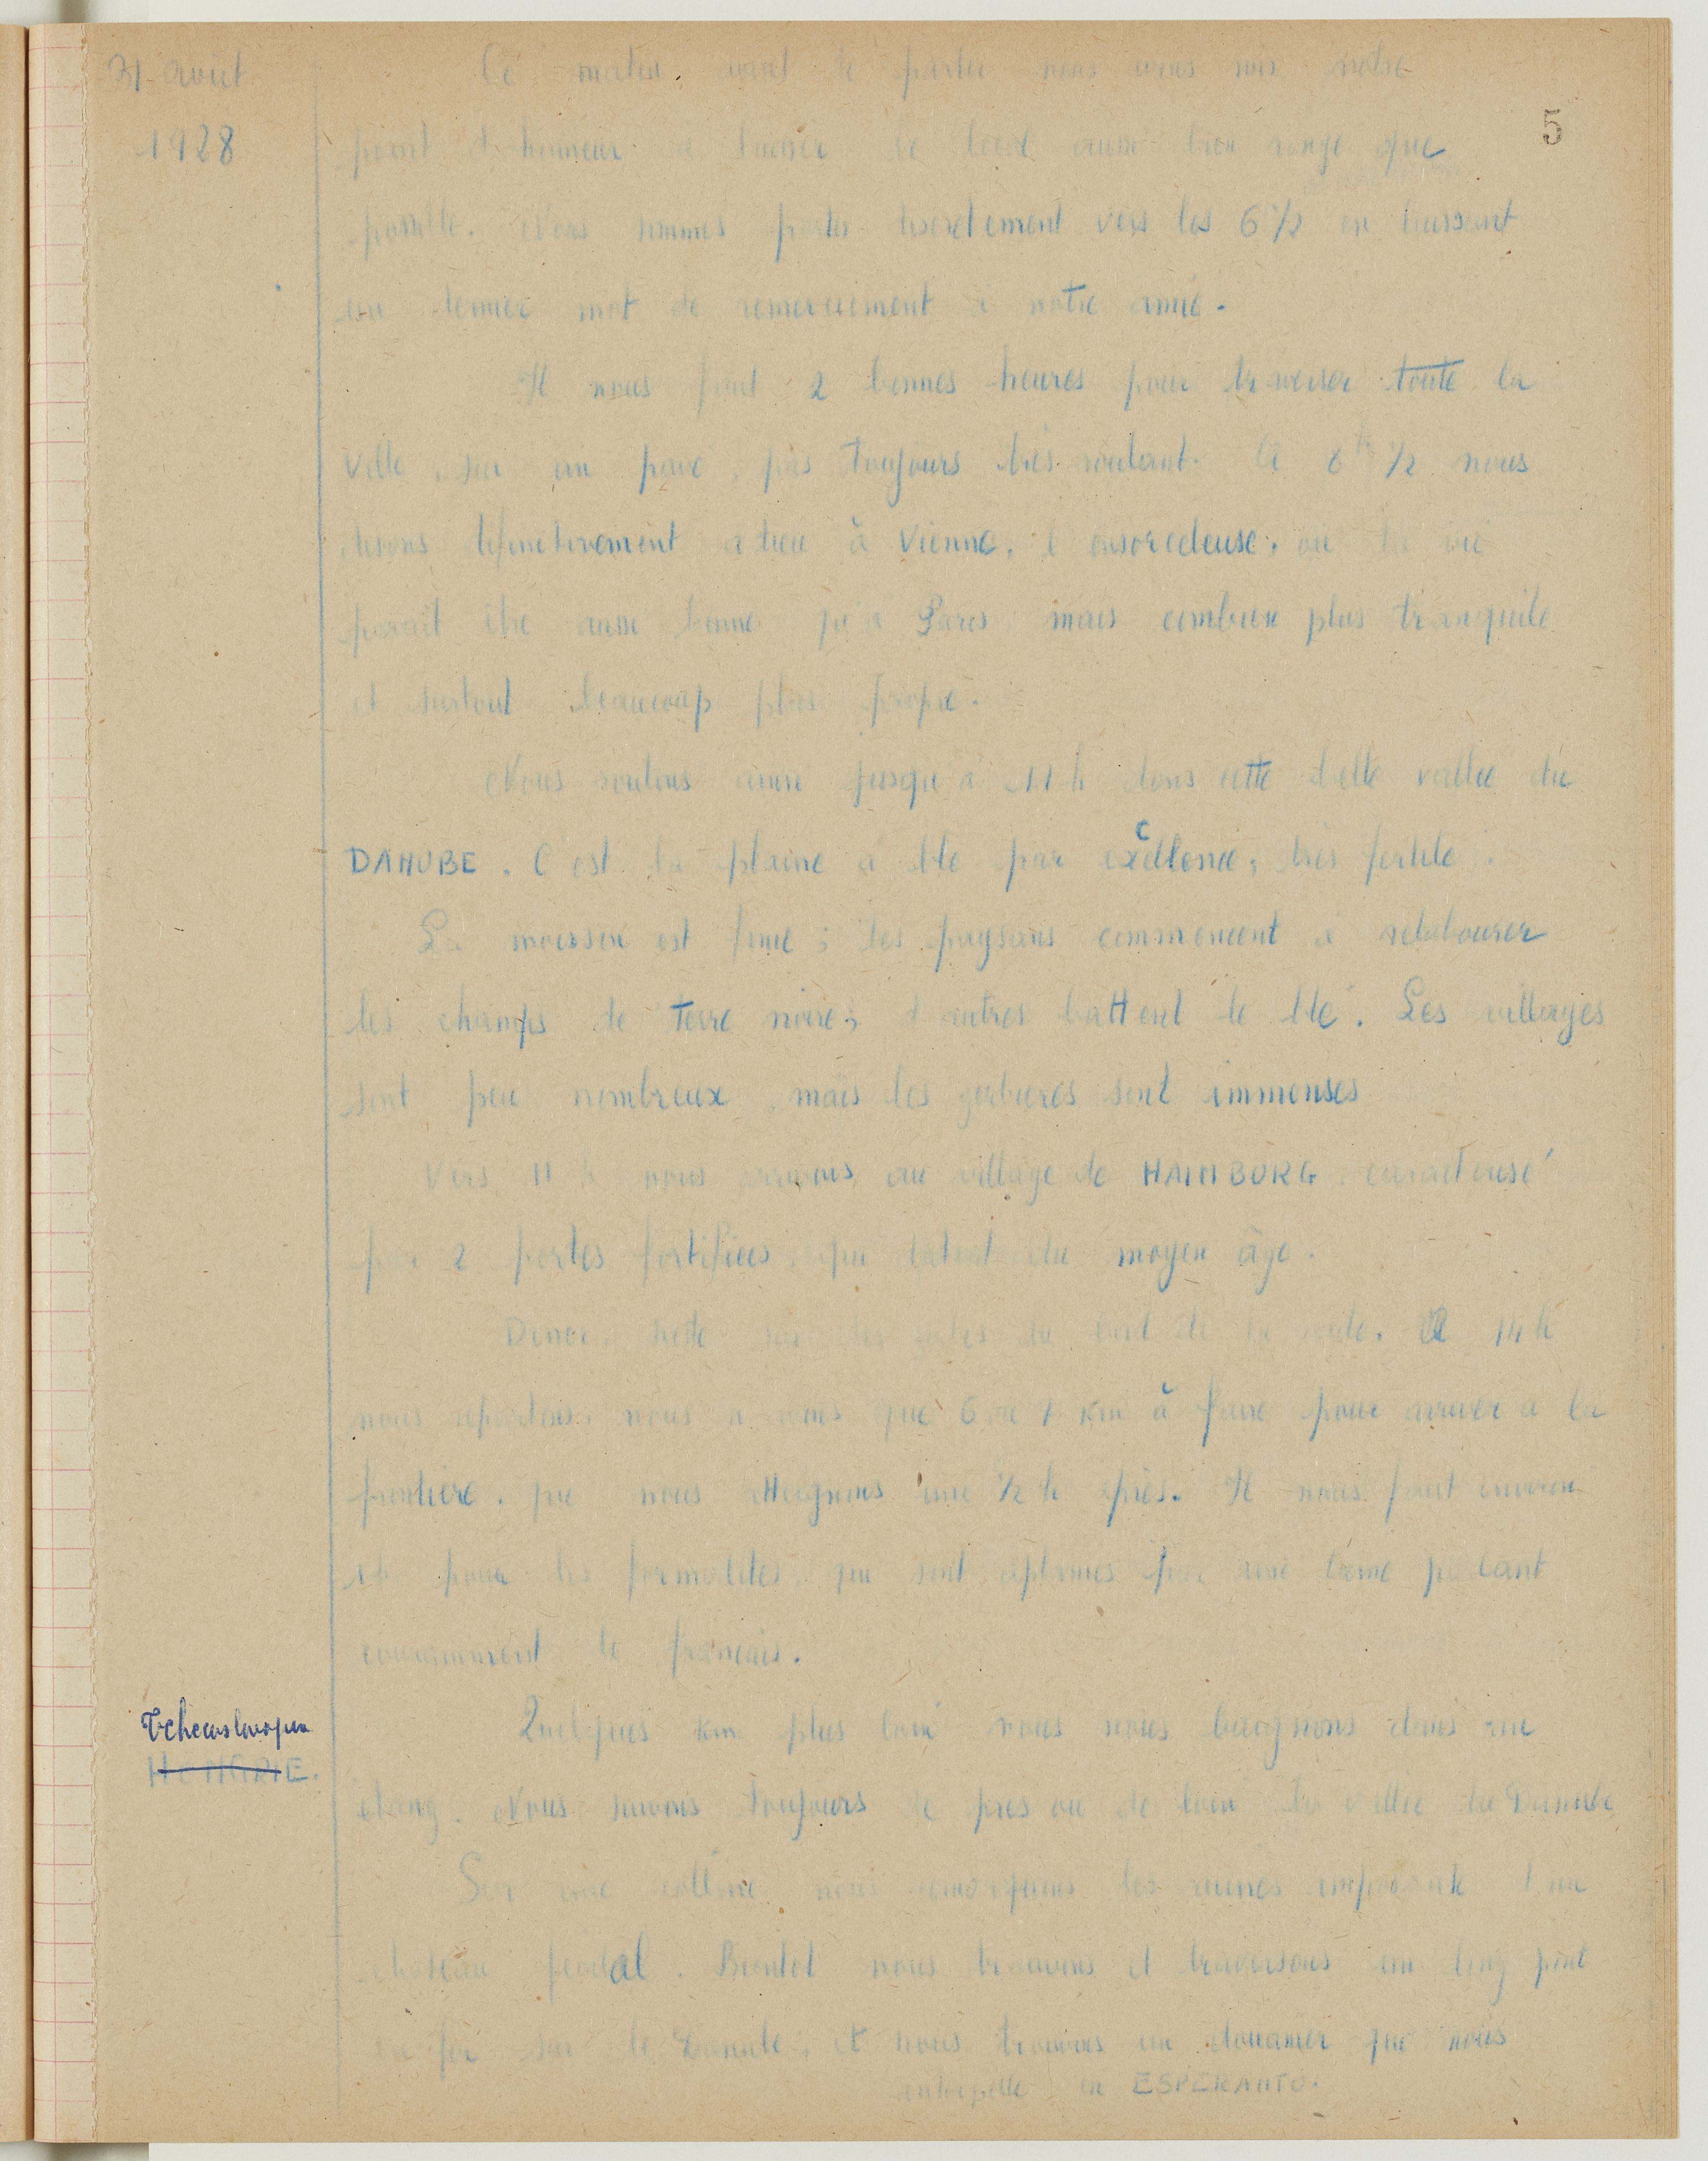
Peraire's notebooks are organized in different series, and each series is divided in ensembles regrouping the pages of a notebook. Each ensemble is named after the countries visited while the notebook was used. For example, notebook 11 in the B series forms one ensemble and covers a part of Peraire's travels in Japan. There are 31 notebooks in the B series. The notebooks of this series are written with a blue pencil on (low quality) school papers. On some pages, the pencil is very faded which makes it hard to read the text, let alone to run a successful segmentation task on the image. On the other hand, the D series gathers notes and comments on the diaries, written at the end of the 1960s. This time the handwriting is much easier to read because Peraire mostly used a blue or black ball-point pen. There are 9 ensembles in this series.
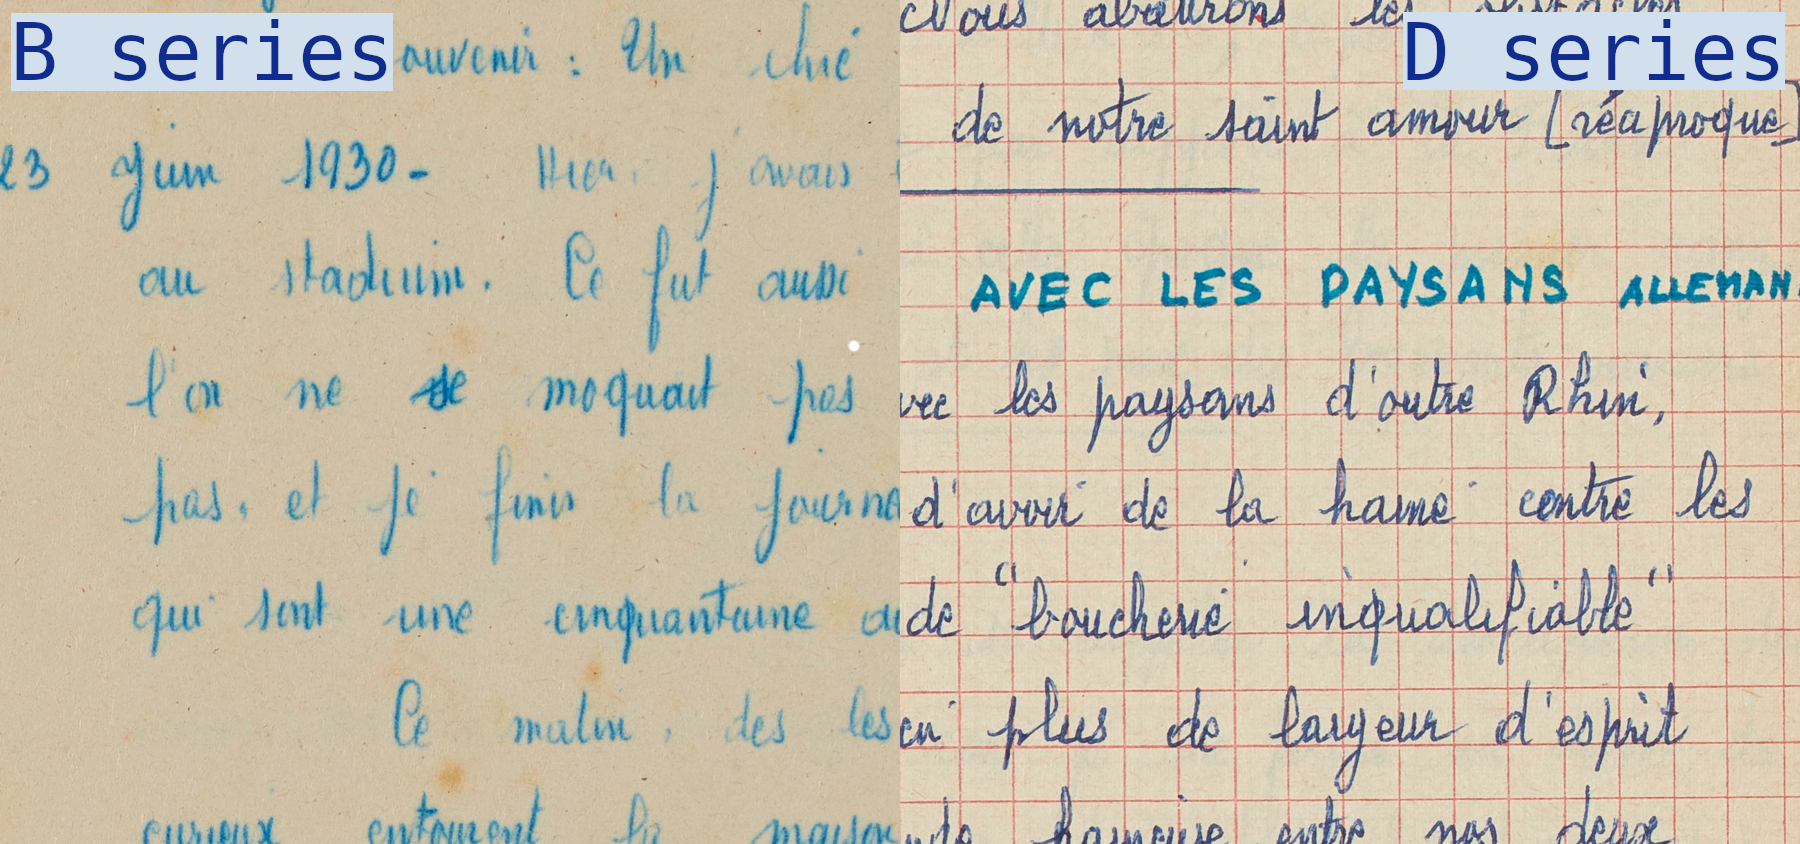
One aspect that I find particularly interesting with this dataset is that we have a case where the handwriting is similar but the writing tool is different. It means that it is possible to explore how the writing tools and/or writing supports affect the efficiency of a transcription model. On top of that, all the documents were digitized under the same (good) conditions and by the same people.
Segmenting, transcribing, aligning and publishing
The first version of the dataset was solely focused on the B series. I selected 1 random page from each ensemble (avoiding to take the first page each time) to compose a train set of 33 files1. On top of that, I selected 4 additional pages from B3, B5, B12 and B18 to compose a fixed test set which would never be used as training data.
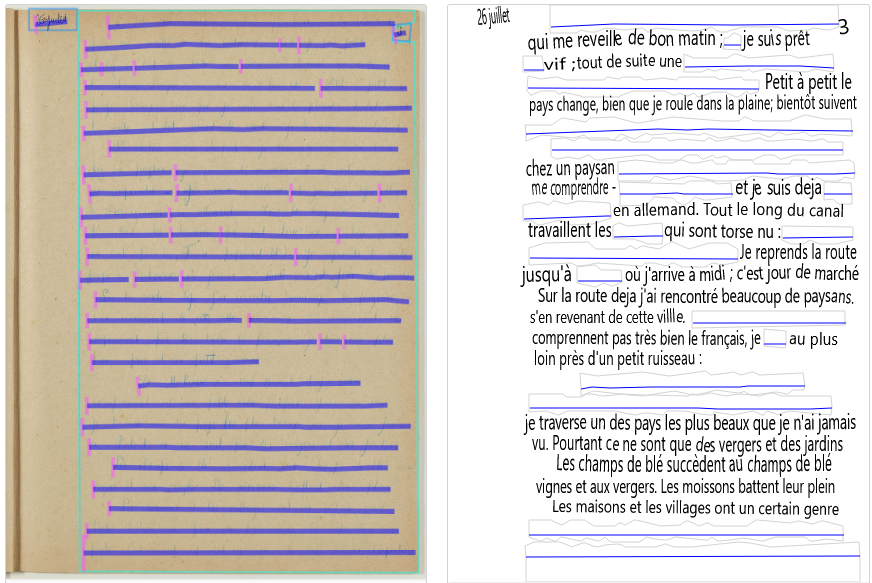
I pre-segmented the images with Kraken's default model before correcting the result manually. At this point, I also applied the segmOnto ontology for the lines and regions2. Because of the fading ink, some words could not be transcribed. In order to avoid complicating the transcription rules, I decided to simply segment out the passages that couldn't be read. On the one hand it simplifies the transcription, but on the other hand, it means that a small portion of my segmented documents cannot be re-used by others to train a segmentation model. Since we were not training a segmentation model, it was an easy decision.
More recently, it was decided to augment the dataset with examples from the D series because the model trained on the B series was not good enough. This time, Gilles Pérez, a member of the project, took charge of the transcription. I recommended to create a new sample of 30 to 40 images, so he randomly selected series of 4 continuous pages from each ensemble. The transcription of the corresponding 36 pages was sent to me as a Word document. Therefore, on top of taking care of the segmentation of the images, I also went through an alignment phase during which I verified the order of the lines and copy-pasted the transcription. It took longer than I expected but it allowed me to align the transcription with the rules I had followed when creating the first set. I also picked 4 of the 36 pages to add to the test set.
The dataset is versioned and published applying the principles and tools we developed withing the frame of HTR-United. I also added illustrated segmentation and transcription guidelines.
Testing different dataset configurations to train transcription models
As I mentioned before, the goal of these datasets was to create transcription models. Taking the opportunity of the recent update of the dataset, I tried different scenarios.
I never trained the model from scratch because the dataset is too small to get any sort of usable model. Instead, I used Manu McFrench as a base model, fine-tuned with the Peraire dataset. (We were actually able to use Peraire as an example during the DH2023 conference3 earlier this month to show the usefulness of having this kind of base model). I tested fine-tuning only on the B series, only on the D series or on both the B and the D series. Then I used a B-series-only test set, a D-series-only test set and the full test set to see how the models performed.
Since I wanted to try it after discovering it during DH2023, I used CERberus 🐶🐶🐶 (I talked about it in my last post) to measure the accuracy of the models on the test sets listed above.
Like KaMI, CERberus takes 2 categories of text input: the reference (aka the ground truth) and the prediction (or the hypothesis made by the model). In order to get the prediction, I loaded my models on eScriptorium, as well as the images and transcription of the test set before applying each model to the documents. This way, all the transcription are predicted with the same segmentation, which comes from the ground truth.
Here are the results:
- Manu McFrench, before fine-tuning, gets a CER of 26.16% when tested on the whole test set, and a score of 27.19% on the documents from the B series, 25.29% on the D series.
- peraire_both, trained on the B and the D series, gets a CER of 4.63% when tested on the whole test set, but a score of 6.41% on the documents from the B series and 3.54% on the D series.
- peraire_B, trained only on the B series, gets a CER of 8.72% on the whole test set, but a score of 7.12% on test-B and 9.67% on test-D.
- peraire_D, trained only on the D series, gets an CER of 16.38% on the whole test set, but this is because of the enormous descripancy between its score on each sub test set. It skyrockets to a CER of 38,53% on test-B while going as low as 3.65% on test-D.
All of this makes sense, though.
- ManuMcFrench could not be used without fine-tuning, its error rate on both documents is too high.
- peraire_both is able to generalize from seeing both datasets and even benefits from seeing more data thanks to the D series, since it performs better on the B series compared to peraire_B.
- peraire_B which was trained on the more difficult dataset seems to use the knowledge inherited from Manu McFrench and to have learned some formal features from Peraire's handwriting since it is able to maintain a fairly low CER on the D series (it gains 16 points of accuracy compared to Manu McFrench).
- peraire_D on the other hand seems to lose it completely on the B series. This is most likely due to the fact that the contrast between the page and the "ink" is too low in the pencil-written series compared to the data used to train Manu McFrench and in the D series. peraire_D even loses 11 points of accuracy to Manu McFrench!
What happens with peraire_D is very interesting because it confirms that it is useful to compose a train set with examples of more difficult documents instead of only showing the ones that are easy to read! Now, the nice thing is that I will soon be working on a little experiment with my colleague Hugo Scheithauer where we will be able to measure the impact of the contrast between the ink and the paper. Stay tuned!
EDIT #1: I added the scores obtained by Manu McFrench alone.
EDIT #2: I added a disclaimer at the beginning of the post.
-
I used 2 images from B2 because one of them was extremely faded and I wanted to include some of these extreme cases in the dataset, and 2 images from B30 because it consisted of shorter lines (table of contents) which I found was interesting to include. ↩
-
As described in the documents, I only used the "InterlinearLine" and "DefaultLine" for the lines, and the "MainZone" and "NumberingZone" for the regions. ↩
-
See the submission and the slides on HAL: https://inria.hal.science/hal-04094241. ↩